

2 July 2025. Politics | Visioning
Political parties have stopped representing their voters // Visioning for transport [J2T #644]

Welcome to Just Two Things, which I try to publish a couple of times a week. Some links may also appear on my blog from time to time. Links to the main articles are in cross-heads as well as the story. A reminder that if you don’t see Just Two Things in your inbox, it might have been routed to your spam filter. Comments are open.
1: Political parties have stopped representing their voters
The British Social Attitudes [BSA] survey has just released one of its studies of voting patterns that concludes that age and education are now the biggest drivers of voting behaviour—and that traditional class alignment around voting patterns is now very weak. Some of this has been true for a while, but some of these conclusions are down, I think, to views of “class” that are down to traditional polling labels rather than actually experienced living conditions.
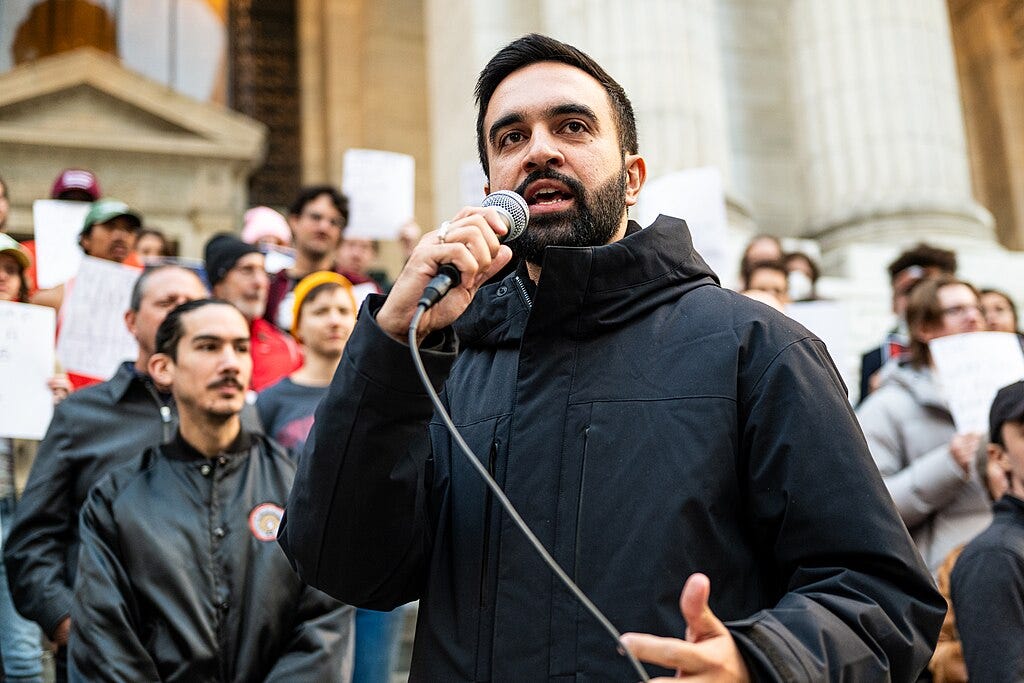
(Zohran Mamdani speaking at a Resist Fascism rally in New York in )ctober 2024. Photo: Bingjiefu He, via Wikimedia. CC BY-SA 4.0)
It was striking that the BSA released this data and analysis pretty much on the same day that Zohran Mamdani pleased some people and astonished the rest by winning convincingly the Democratic Primary to be the party’s candidate for Mayor of New York. Mamdani is 33, and seems to have won by energising younger voters who had become alienated by the Democrats (perhaps because of its geriatric leadership).1
I’m going to start by pulling out some of the BSA commentary, while also noting that some of it is skewed by the collapse in the Conservative vote at the 2024 election. But here’s one of their headline points:
Age was the biggest demographic dividing line. The Conservatives were seven points ahead of Labour among those aged 65 and over, but were 35 points behind among those aged 18 to 24.
What’s striking about the BSA analysis is the way they position the traditional perspective of how politics used to work, as a representation of class interests, the Conservatives as the party of ‘business’, the Labour Party founded by trades unionists and representing the interests of working people. So:
[T]he two main parties, the Conservatives and Labour, tended to represent the interests and values of two distinct groups in British society... Labour tended to be more popular with those on the ‘left’, that is, those concerned about the level of inequality and who feel the government should be trying to reduce it. The Conservatives found it easier to win votes among those on the ’right’, that is, those who prioritise creating the economic incentives that will persuade entrepreneurs to invest and thereby secure the economic growth from which all will benefit.
It’s striking that the references from this passage are from the 1960s and the 1980s. And just reading it makes it feel like a different world. But the hypothesis sitting behind it is that
the country’s two-party system has ensured that governments have been held to account while diverse class interests have been represented.
And that,
[t]hese two key attributes are thought to have underpinned voters’ trust and confidence in how they were being governed.
So if this your hypothesis, you can see why you might be worried about shifts in the underlying characteristics of voting behaviour.
The tables they use to demonstrate that voting is now more based on age and education aren’t that easy to read—they’re shares of actual voting percentages, so I’m not going to share them here.2 They’re also not helped by the shift of votes to parties beyond Labour and Conservative. But here’s an age summary from the commentary—the strongest single divider:
Despite a sharp fall in support among the party’s older voters, at 36%, support for the Conservatives among those aged 65 and over was more than four times the level of 7% recorded among those aged under 35. Meanwhile, Labour won 49% of the vote among those aged 25 to 44, but just 29% among those aged 65 and over.
There’s also quite a strong education effect, but this is almost certainly mostly a result of the age skew—far fewer people went to university when older voters were being educated. At the very least I’d expect people doing this kind of analysis to have go at estimating the size of this rather than just printing the breaks in their data for education against political party voted for.
And when you look at the data by the age breaks, it is pretty clear that people of working age tend to have voted Labour or for the Green party, and people of retirement age tend to have voted Conservative (or to a slightly lesser extent the hard-right Reform party).
So maybe there’s a different interpretation available of what’s going on here. Because it looks as if, in terms of their electoral base, Labour is still broadly the party of those that work, but the Conservatives are no longer the party of business. (They, and Reform, seem to be competing for the affections of an extractive—but rich—fraction of finance capital, characterised by hedge fund owners and private equity.)
And rather than representing the interests of their working voters, Labour has pursued the interests of business. In short, “diverse class interests” are no longer being represented by the political system.
There’s a bit more to this. The BSA has a scale that assesses where voters sit on a scale of libertarianism/ authoritarianism (assembled from several of their attitudinal questions). Labour voters are strongly libertarian, Conservative voters strongly authoritarian. But in government, Labour keeps rolling out authoritarian measures3 and declines to reverse authoritarian measures introduced by the Conservatives when they were in government.
In other words, there might be quite a good alternative explanation for a loss of trust in politics: that parties are choosing not to represent the people who elected them. There is, obviously, a ‘why?’ question sitting behind this, and my best explanation is ideological capture of political elites by zombie neoliberal ideas, and their over-exposure socially to the super-wealthy.
And this is where Zohran Mamdani comes into the story. All the usual caveats: New York City is not a typical area; what works in New York City probably won’t work elsewhere in the United States, etc etc.
But Mamdani came from nowhere to defeat the former governor Andrew Cuomo, who had a big polling lead and heavy financial backing despite the cloud of reputational issues that follow him around.
The first data point here is that he got young people out to vote: here’s a helpful chart from the New York Times on this.
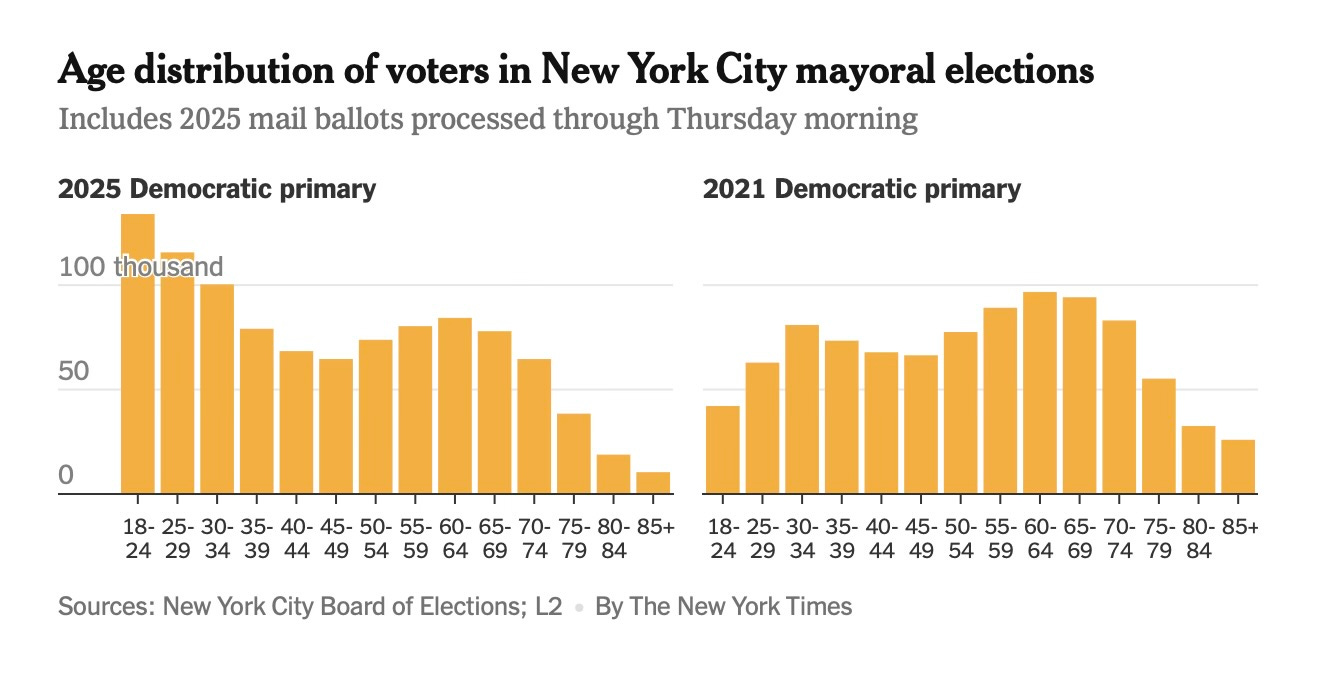
(Source: New York Times)
And he did this through a relentless focus on economic issues, and some radical policies that might alleviate the economic pressure—in terms of day-to-day living costs—on people living in the city who were not rich. As Adam Tooze put it in his Chartbook newsletter,
Mamdani ran on a progressive platform of measures regarding rents, taxes, public transports, childcare etc that address the palpable crisis of affordability in the city. Others will try to figure out whether it was Mamdani’s position on rent control that was decisive, as opposed to his position on Gaza. It does seem clear that Mamdani has rallied a new coalition that is heaviest in the “middle-income band”.
Tooze quotes analysis by Peter Ryan that overlays New York income data against voting profiles: the blue line is Mamdani, the red one Cuomo, and the green one is another progressive candidate Brad Lander, who ran third.
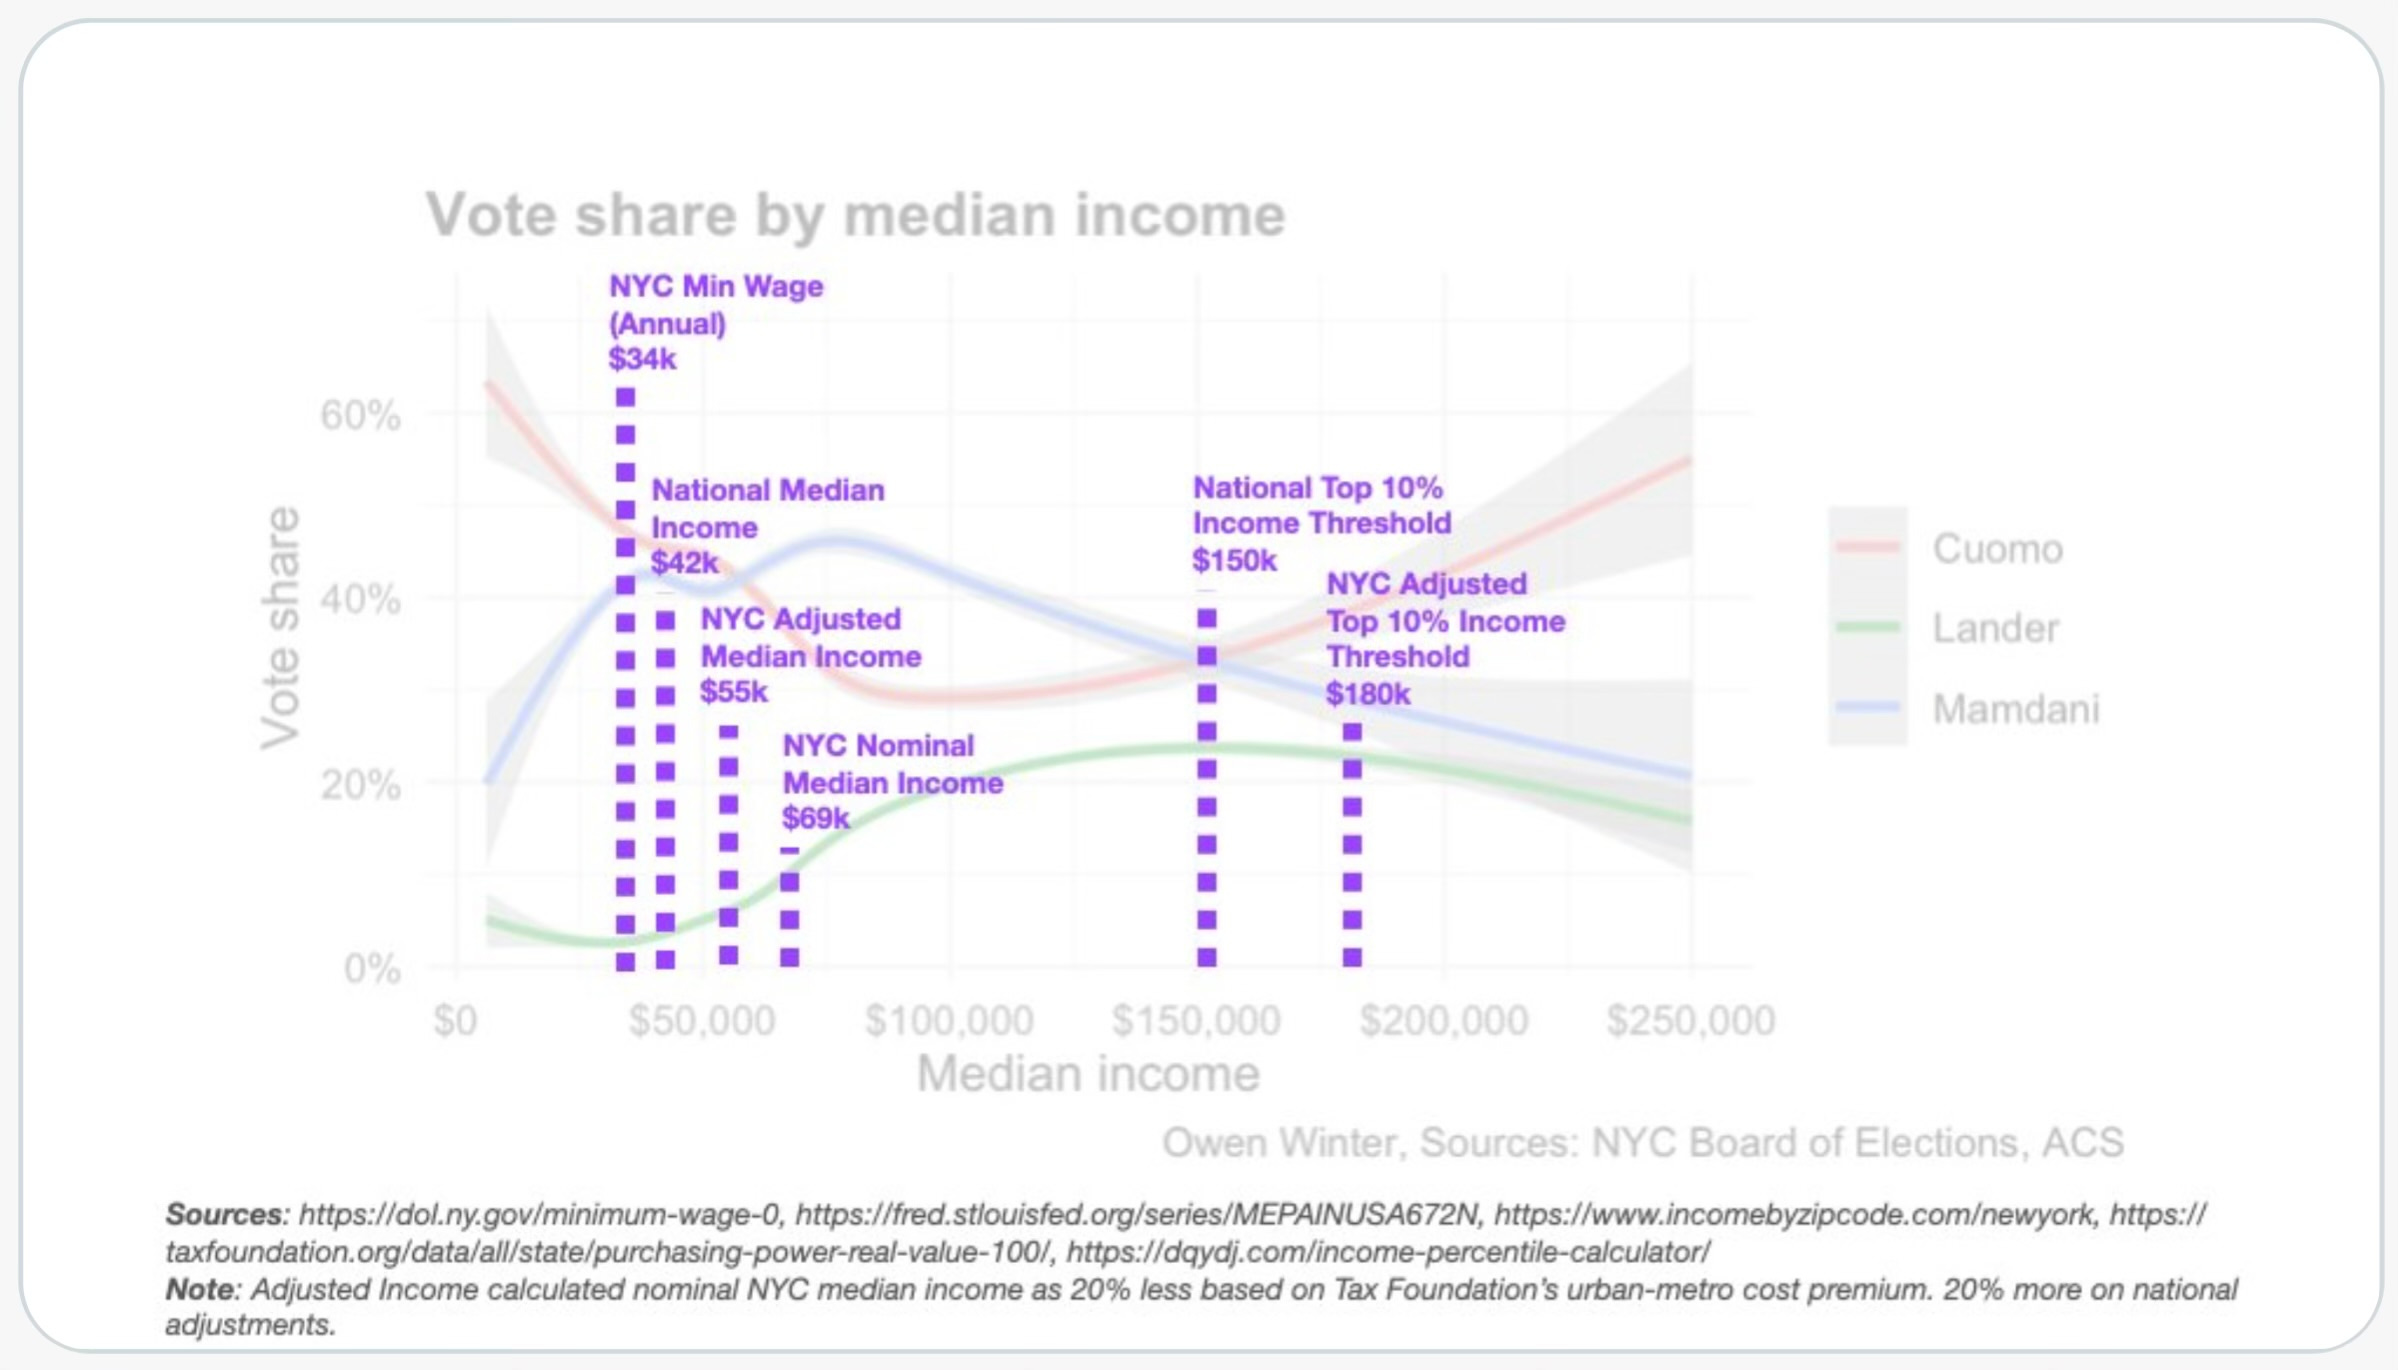
(Source: Peter Ryan via Chartbook)
Income isn’t class, of course, but we don’t really have the data for that. And it is a reasonable proxy. The rise of the knowledge/services economy has created new forms of class, as I argued in a 2017 paper. It’s quite a complex argument, but a couple of quotes might suffice. From Hardt and Negri:
The center of gravity of capitalist production no longer resides in the factory but has drifted outside its walls. Society has become a factory.
Or Cederström and Fleming:
Life itself is now the most lucrative kind of capital being put to work, from the hipster marketing firm to the call center sweatshop.
And we have seen similar arguments in the UK about the importance of economics, and of working life, in creating more trust in politics. The Labour MP Jeevun Sandhar has made this argument in his newsletter:
If we want to win the next election, we need to make life affordable for our voters... Firstly, we can directly lower costs for all voters through investment. As energy and housing costs are fixed costs, which are higher as a proportion of poorer households’ incomes, this is a progressive policy measure that helps the hard-up the most... Secondly, we need to actively create good non-graduate jobs, with a focus on post-industrial areas.
This goes back to the question of ‘where did the money go to?’. And half of the answer is that some of it went to Asia, notably China, because manufacturing businesses used more open global trade rules to drive down their costs. And the other half is that extractive rentier businesses have driven up living costs, all over the place. This sounds like quite old-fashioned class politics to me.
And in case you’re wondering: no, I don’t think vibe-based political speculation about ‘Up’ and ‘Down’-based politics has got anything meaningful to add to this analysis, even if the tech bros seems to like it.
2: Visioning for transport
One of features of futures work is that there’s far too much literature on how to do scenarios, and not enough on how to do visioning. There are multiple reasons for this, but the most obvious ones are:
that early visioning practitioners such as Elise Boulding and Warren Ziegler, or Robert Jungk, were working in areas such as peace building and community democracy that were explicitly political, whereas scenarios practitioners would mostly pretend that there was nothing political about their work; and
perhaps related, it took a long time for the mainstream theory of futures work to change so that it acknowledged that it was possible to have agency to influence the futures.
Incidentally, the best single guide on visioning, which includes a discussion of the work of Boulding and Jungk, was written by Wendy Schultz as an internal briefing report for Policy Horizons Canada. It was published online, with their approval, but not by them. It deserves to be published properly.
This is a long way in to saying that I was pleased to be invited to join a group of colleagues at Mott McDonald with whom I’ve worked on transport futures since 2018 to collaborate on a paper about ‘Visioning for Transport Practitioners’. (This is a sequel to an earlier paper we’d written together on ‘Scenarios for Transport’.)
The paper has just been published, and it’s open access. Although it’s very much focussed on transport, I think the questions that we developed to frame the paper might be of broader use in other sectors.
I should also, before I get into the detail, acknowledge my co-authors: Glenn Lyons, Charlene Rohr, Annette Smith, Anna Rothnie, and Janice Jaison.
One of the reasons why visioning is important in the transport sector is that as long ago as 2000 the government instructed local authorities to do visioning with their communities:
“Local authorities must lead their communities, organise and support partnerships to develop a ‘vision’ for their locality and to contribute to achieving it. The vision describes what the area should be like in the future. It identifies how people want to live and recognises local strengths, weaknesses and opportunities.
This was just at the point at which transport planning was moving away from the road-building transport paradigm of “predict and provide” towards a model that Glenn Lyons and others labelled as “decide and provide”.
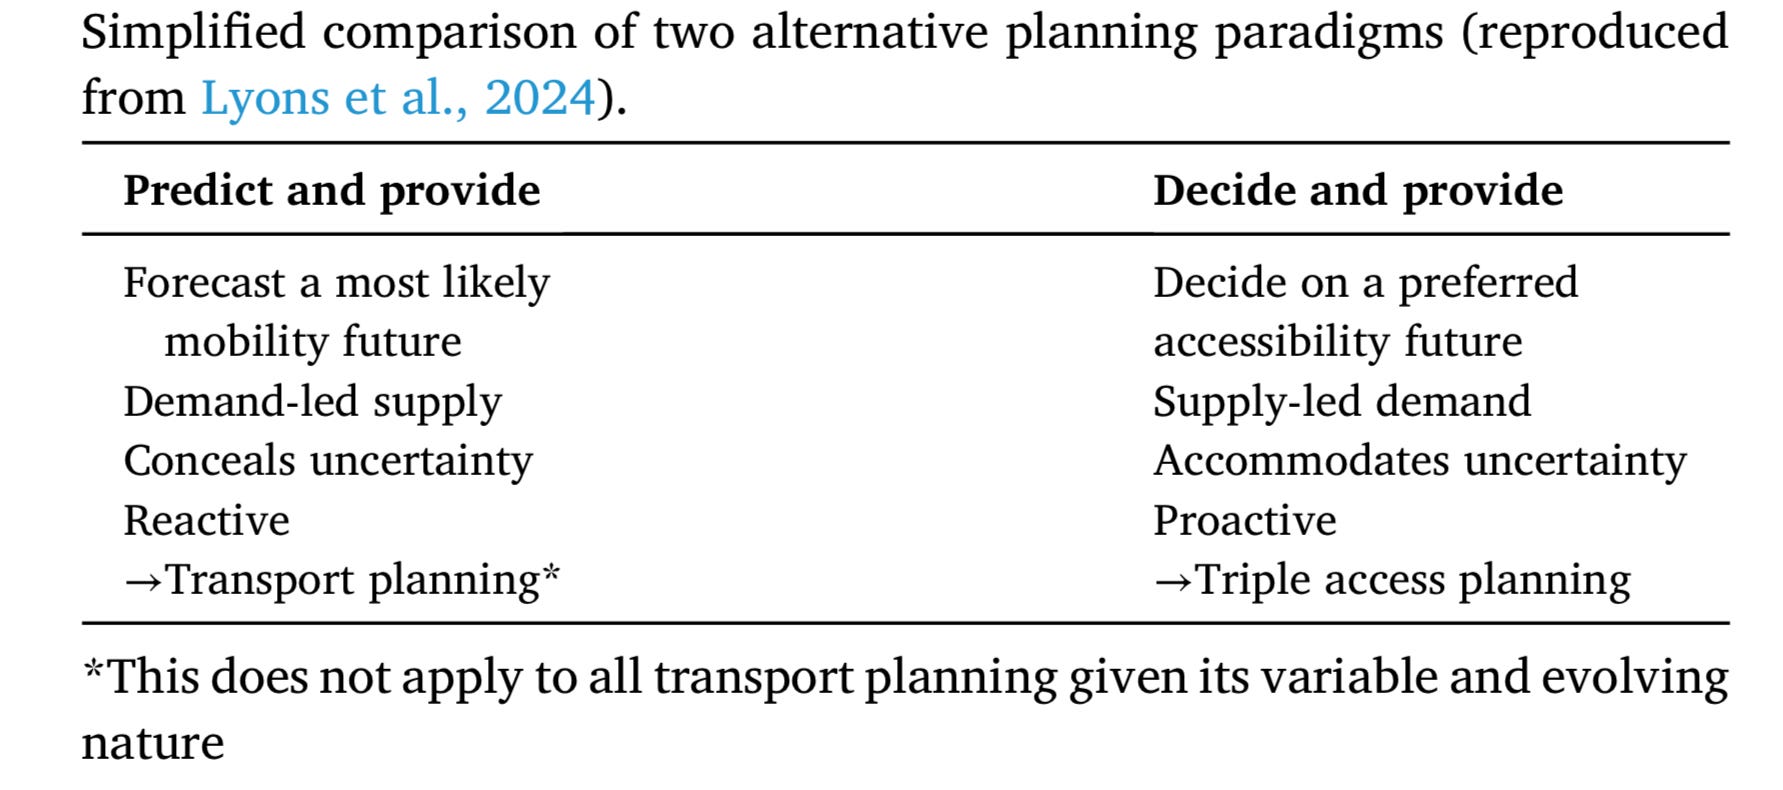
(Source: Lyons et al., Visioning for Transport Practitioners)
By this time, planners had realised that road-building created demand for car use rather than just being a response to it; “decide and provide” meant that planners started to take into account a bigger range of interests in transport planning than just moving cars and other vehicles around.
The Mott team has been busy for a decade in helping to embed the ‘decide and provide’ approach, using visioning techniques and helping planners to accommodate uncertainty. I’ve worked with them on some projects where we’ve taken visioning techniques into a government department. The paper combines some of this practical experience with more theoretical insights from the literature.
It also includes a case study from a Mott McDonald visioning project for Cheshire West and Chester, which this image comes from.
(Communicating a vision. In Lyons et al, with the permission of Cheshire West and Chester).
The paper is built around a checklist of 10 questions—an approach that worked well for the previous scenarios paper. Why these 10 questions and not a different 10? As a writing team we sat down and reviewed the questions we had been asked by clients in new business meetings and during projects, and this is what we were left with:
What is a vision?
Why are visions worth developing?
Who should be involved in visioning, how and why?
How is the scope of a vision clarified?
How far should the bounds of future possibility be stretched?
How is a vision developed?
How much time and effort are needed for visioning?
How do you know a good vision when you see it?
How is a vision brought to life?
How is a vision put to work in the planning process?
Looking at this list, and thinking it through as a part of a project process, it becomes clear that there are a lot of interdependencies, and that the development process of a vision needs to be iterative. It also needs genuine engagement, in which communities have the opportunity to shape their own outcomes.
(I have a personal antipathy towards the use of the words “buy in” in visioning, because it implies a one way process in which people agree, or not, to something that they have little chance to influence. I thought I’d succeeded in removing all references to “buy-in” from the paper, but it looks like a couple have survived my cull.)
Given that government guidance on visioning goes back 25 years, and normally in the transport sector that means that guidance documents are rolled out, one of the things we were struck by was how little public guidance there was for organisations about doing transport visioning:
while some processes in transport planning are well-established with accompanying guidance, transport visioning has been undertaken in a rather more ad hoc manner, sometimes reliant as much on instinct and intuition as methodological direction.
It’s also possible to think that doing some of this more normative work before starting on big projects might reduce the conflict around them.4 The whole discourse about how difficult it is to build in Britain (see also the ‘Abundance’ agenda in the US) is at least partly a function of over-centralised political power and mistrust of top-down politics.
As Dan Davies wrote in a recent post,
The problem with the regulatory state and abundance might not be the regulations themselves, but the way in which the regulatory system facilitates strategic behaviour. (A major factor in the Sheephouse Woods Bat Structure [a proposed mitigation for the HS2 rail link], our favourite example, was the utterly cynical use of Tree Protection Orders by Buckinghamshire Council).
As we note in the paper,
In the UK, particularly for what are known as ‘nationally significant infrastructure projects’ (NSIPs), significant challenges and protracted timescales have resulted, it would appear, because the importance of a co-created and shared vision was not given sufficient attention and priority early on.
The Sheephouse Woods Bat Structure would cost £100 million, and even the most gold-plated visioning project would come in at a tiny fraction of that. But if HS2 had gone through any kind of visioning process, we might have realised that the High Speed bit—which created a lot of cost—was less important than increasing rail capacity. And that most of that capacity was needed north of Birmingham, not between Birmingham and London. Because visioning, when done well, also allows more voices, with more perspectives, into the room.
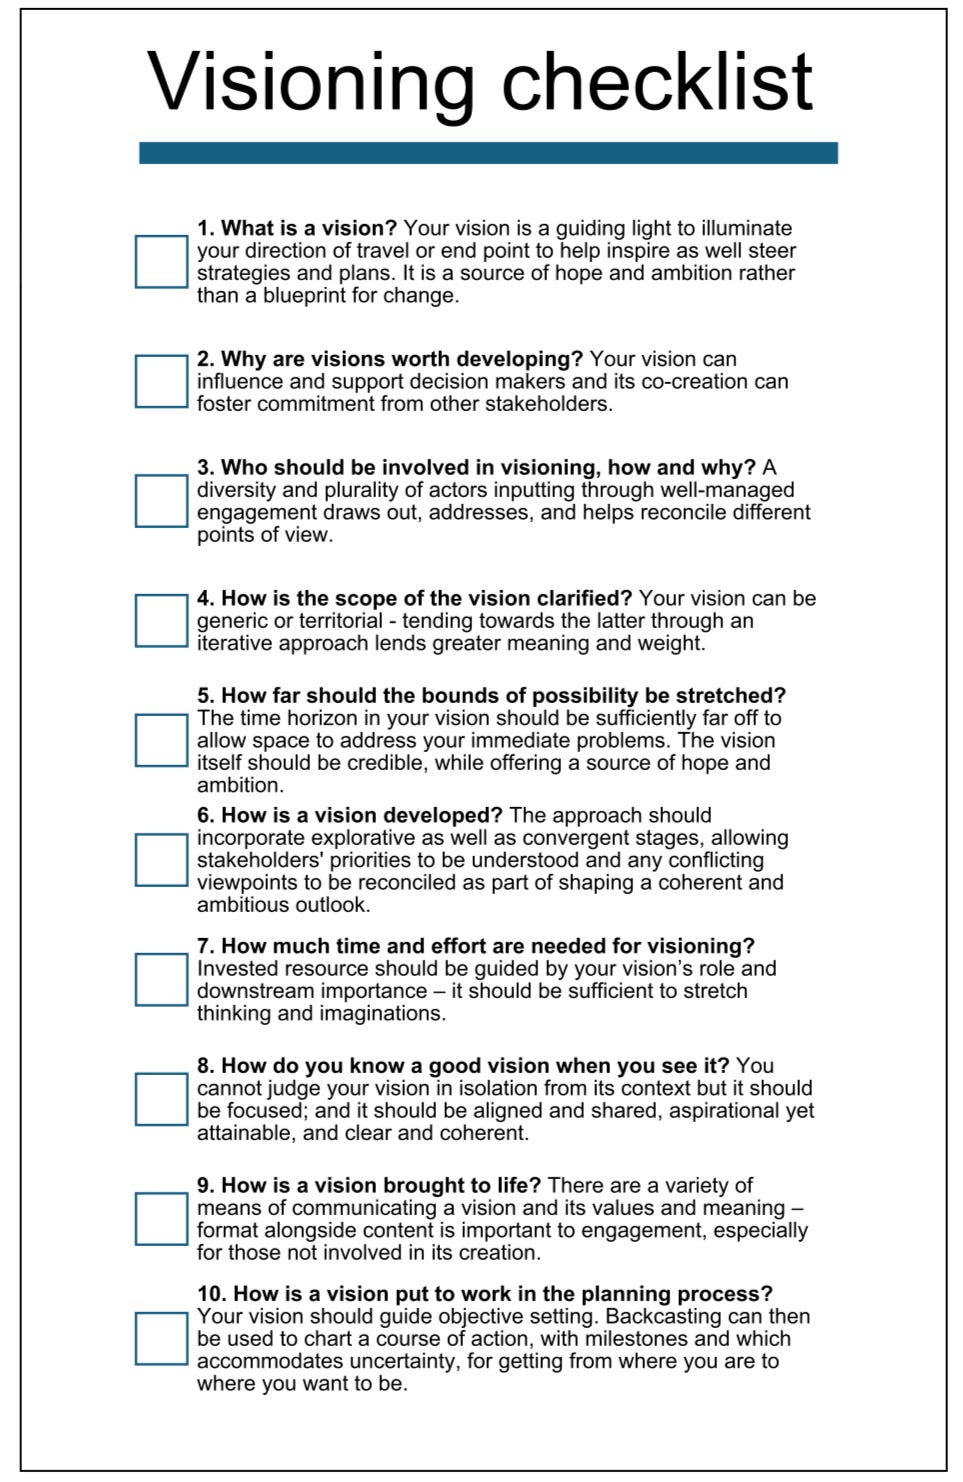
(Summary checklist. From Lyons et al, Visioning for Transport Practitioners.)
j2t#644
If you are enjoying Just Two Things, please do send it on to a friend or colleague.
You can add your own lists of reasons here.
Note to British Social Attitudes: there’s at least 20 ways to use this data better to show your story.
When UK Home Office civil servants are concerned about the authoritarianism of a measure, given the many things they don’t speak out about, you can be confident that you’re a long way down the authoritarian scale.
We don’t discuss it in the paper but there are ways to deal with normative conflicts during these processes.