18 August 2023. Polycrisis | Marriage
Understanding the polycrisis through hockey sticks and crosses. // The British have almost stopped getting married. [#488}
Welcome to Just Two Things, which I try to publish three days a week. Some links may also appear on my blog from time to time. Links to the main articles are in cross-heads as well as the story. A reminder that if you don’t see Just Two Things in your inbox, it might have been routed to your spam filter. Comments are open.
1: Understanding the polycrisis through hockey sticks and crosses
We’d been talking about the polycrisis at work today, as you do, and just as the meeting finished an article appeared in my inbox with a set of charts that set out to describe the polycrisis. The article, by Anthea Roberts and Nicolas Lamp, in Phenomenal World, is called ‘Hockey Sticks and Crosses’, because:
Two types of images are key to understanding current debates about economic globalization: the hockey stick chart, representing the stunning and inexorable growth of some phenomenon; and the cross chart, whose lines represent changes in relative power and prosperity.
The article is based on their book Six Faces of Globalization, which sets out to untangle the narratives that shape globalisation.
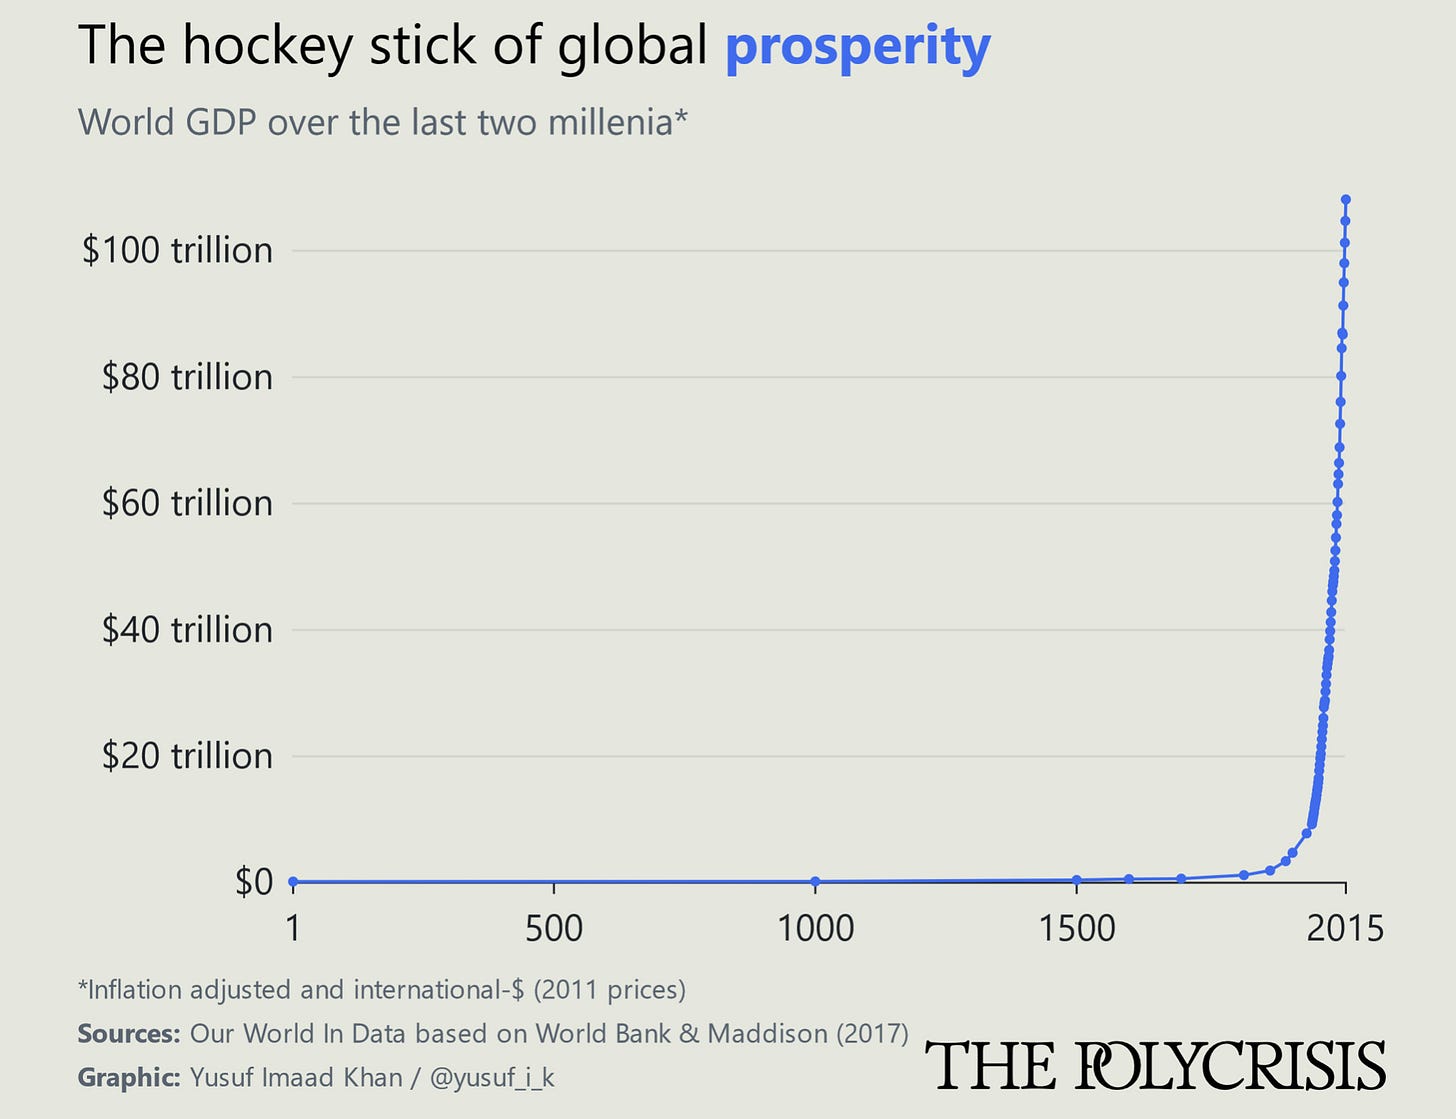
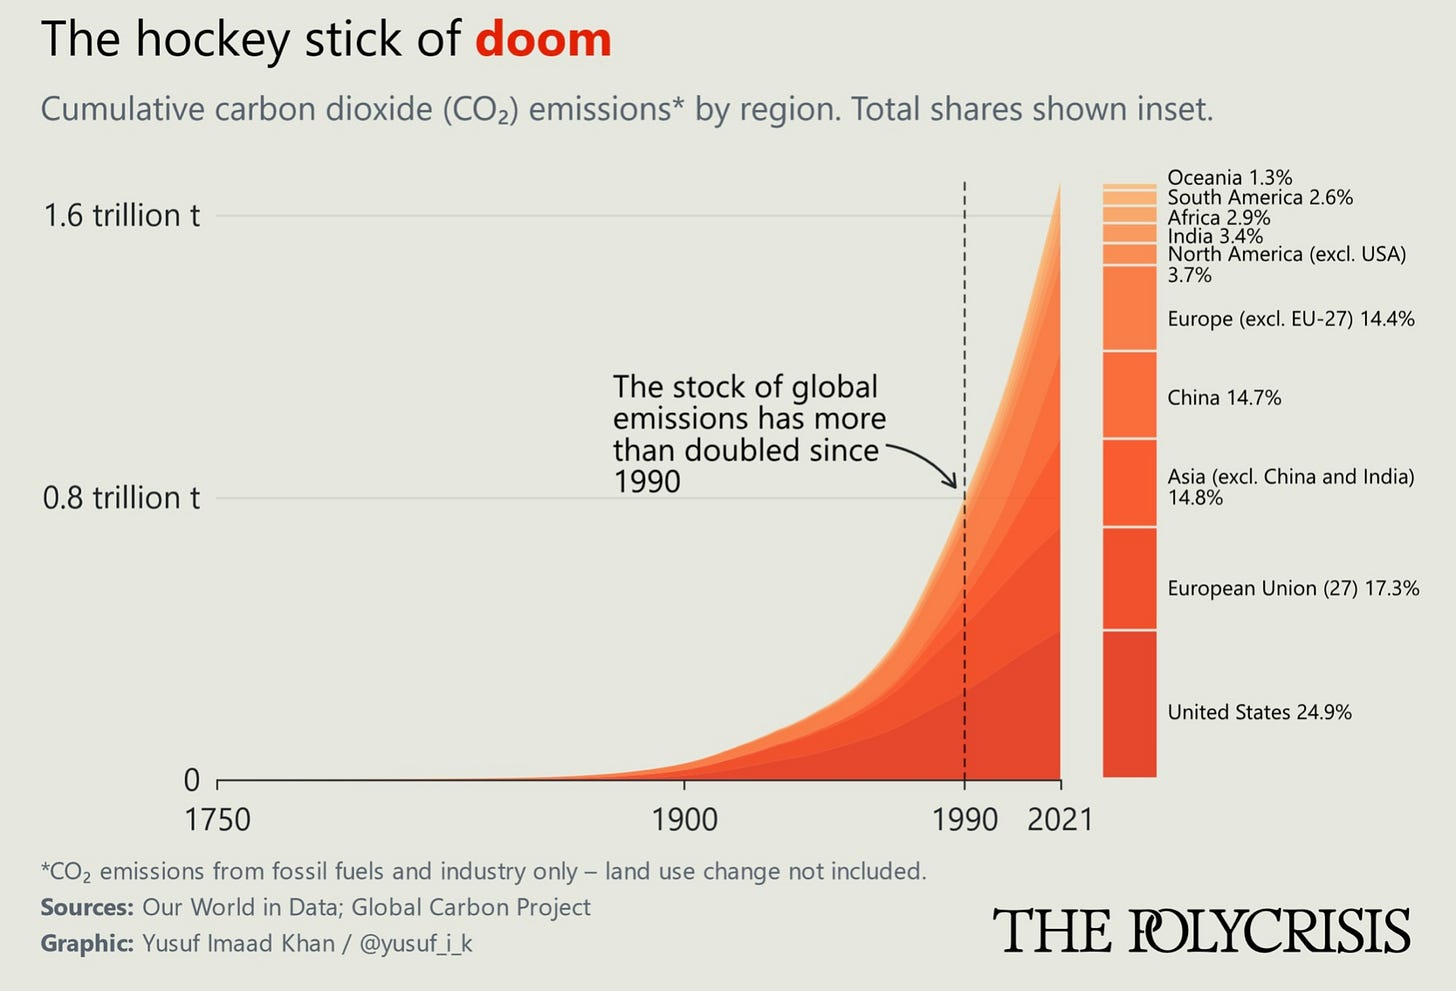
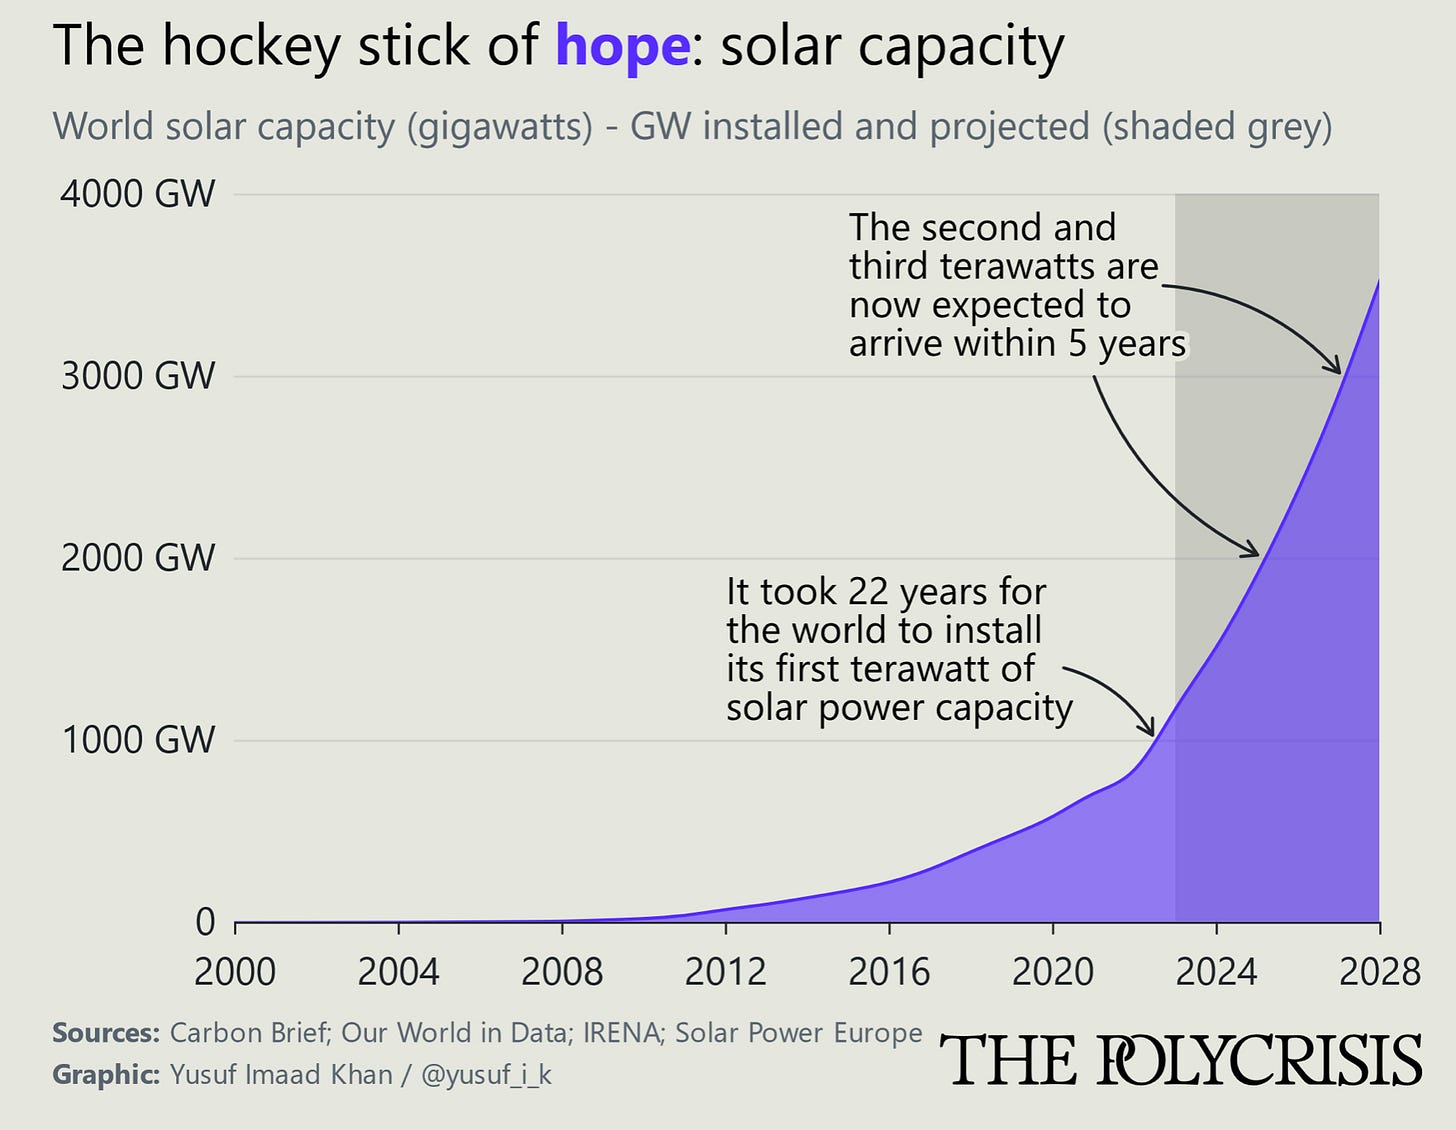
The hockey sticks represent different types of rapid acceleration: prosperity; doom; and hope.
The crosses represent different shifts in power: global power; work; income; and tax. (Some of this data is purely American, but has similarities with other countries.)
So let me just walk through these charts, with a little of their commentary.
Prosperity
One of the reasons this looks like a hockey stick is because of the timescale: the starting point really is 1CE. This is the official version of capitalism, which you hear from advocates of globalisation:
Economic activity was stagnant for most of humanity’s existence until, sometime around the nineteenth century, a combination of technological innovation and international trade unleashed productivity, creating unprecedented riches.
There are caveats to this story. If it is going to work, governments need to involve themselves in labour markets, helping workers adjust to changing demand for labour, and need to help to redistribute wealth. (And we’ve seen over the last 40 years what happens when governments neglect that part of the story.)
But the bottom line of the establishment view is clear: we must have more technological innovation and economic integration to stay on the ever-rising hockey stick of global prosperity.
Doom
The other half of this is the emissions hockey stick, which I’d suggest can also be thought of as the balancing or restraining systems loop to the reinforcing loop above of technology and economic integration.
The storyline supported by this chart, which one could call the “Anthropocene narrative,” focuses on how globalization has facilitated the diffusion of carbon-fueled patterns of production and consumption, which are fast making large sections of the planet uninhabitable.
And the article includes a fantastic set of hockey stick charts that map out a whole range of prosperity sticks, from GDP to energy use to paper production, and so on, and whole lot of doom sticks, such as CO2 or ocean acidification or tropical forest loss.
There’s a third hockey stick here, and that is hope.
Hope
This is a double edged sword, of course. It might bend the doom loop, but it might just represent more technological innovation that keeps the prosperity stick accelerating upwards, unsustainably.
The hockey sticks tell one kind of a story. The crosses tell a different story — about distributional conflict.
Global power
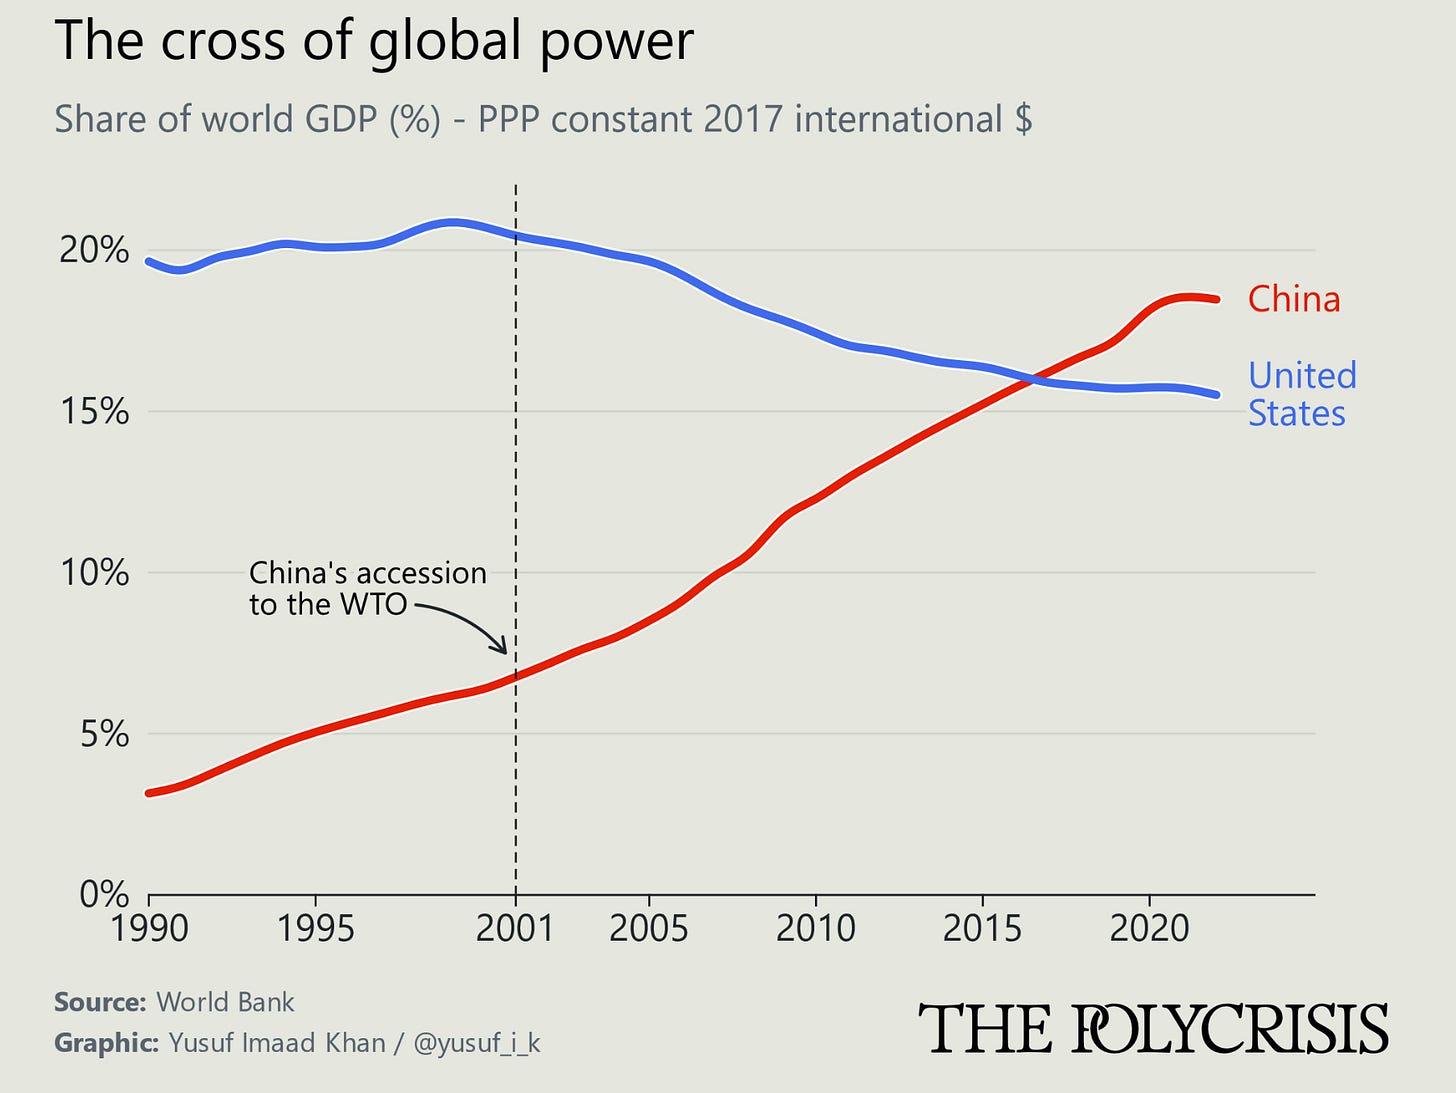
China has used the acceleration of globalisation to close the gap on the United States, and the first cross is—effectively—the Chinese economy overhauling that of the United States, when measured on purchasing power parity.
They write:
This cross propels the “geoeconomic narrative,” which treats economic security as national security and frames China as both an economic competitor and a security threat to the US and other Western nations. Instead of focusing on win-win outcomes from economic integration, this narrative emphasizes the vulnerabilities created by economic interdependence with a strategic rival.
Work
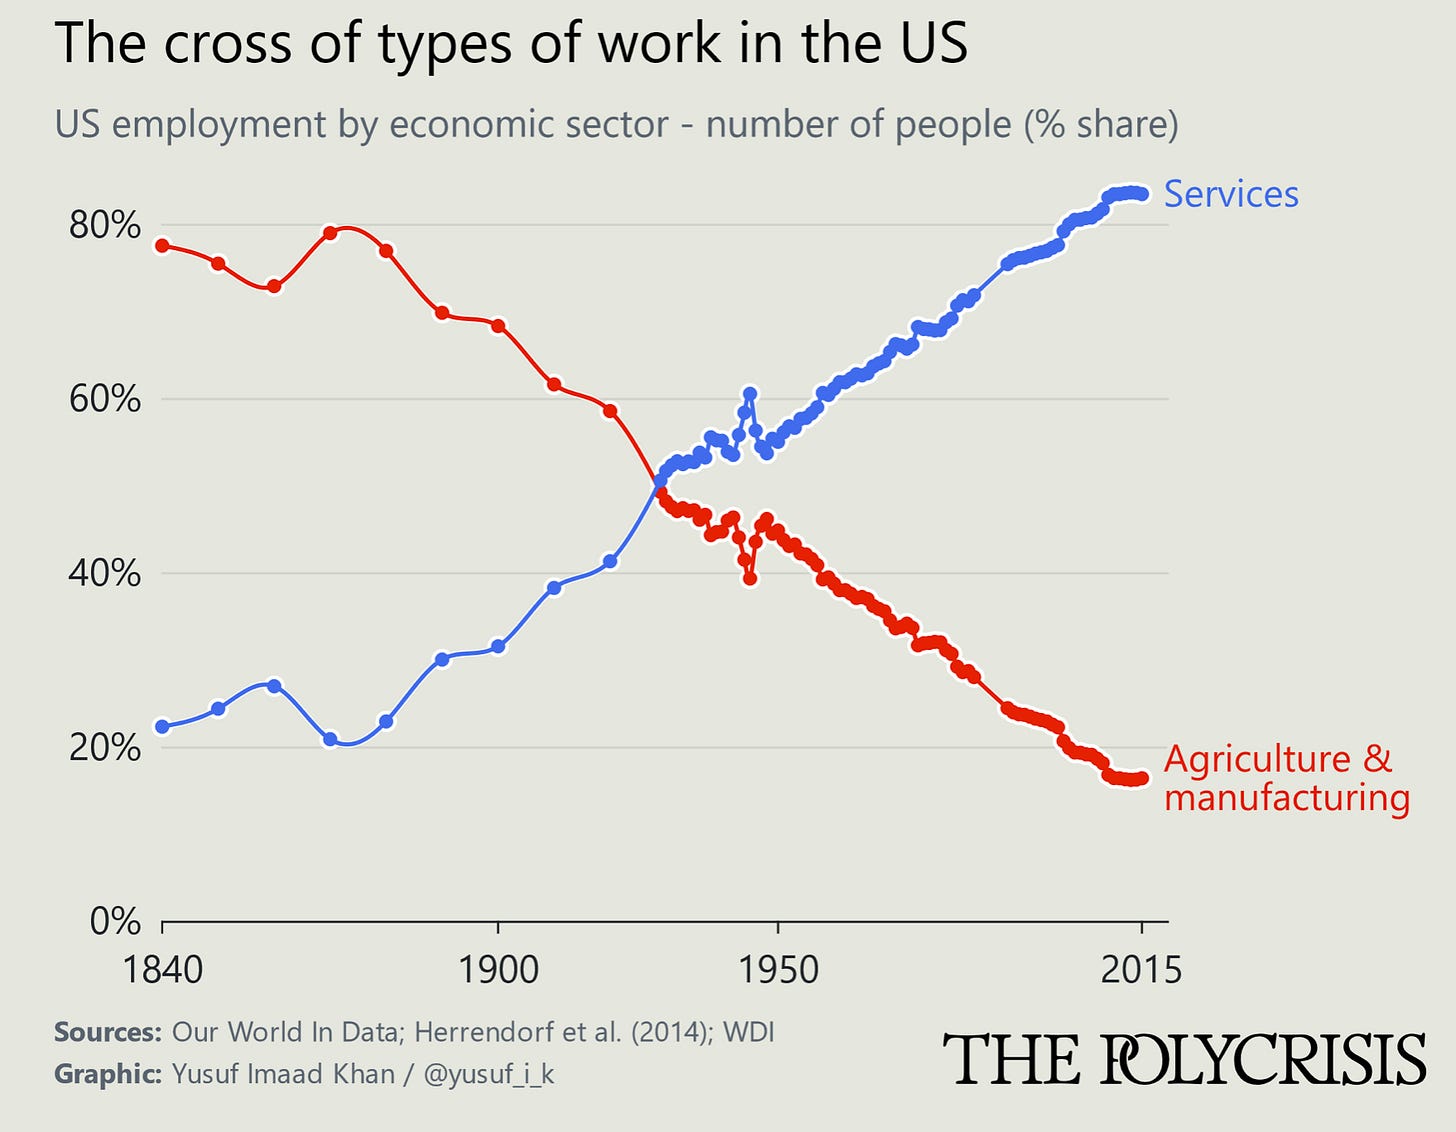
The rest of the crosses are specifically American. One tracks the shift in types of work in the US, and actually it crosses very early.
The regions hit particularly hard by the loss of well-paying factory jobs were ones that offered few alternatives; in these cities and towns, the closure of factories permanently depressed economic activity, bringing deaths of despair in its wake... Moreover, the decline of manufacturing disproportionately affected white men without a college degree.
I’m not sure that this is measuring quite the right things, because those well-paid factory jobs persisted through to the 1970s, which in the US (as in the UK) marked to point at which the share of labour peaked against the share of the capital. I’ve written about this elsewhere (pp5-6), but it’s possible to argue that it took three decades for the economic effects of this transition to be felt in the labour market.
Income
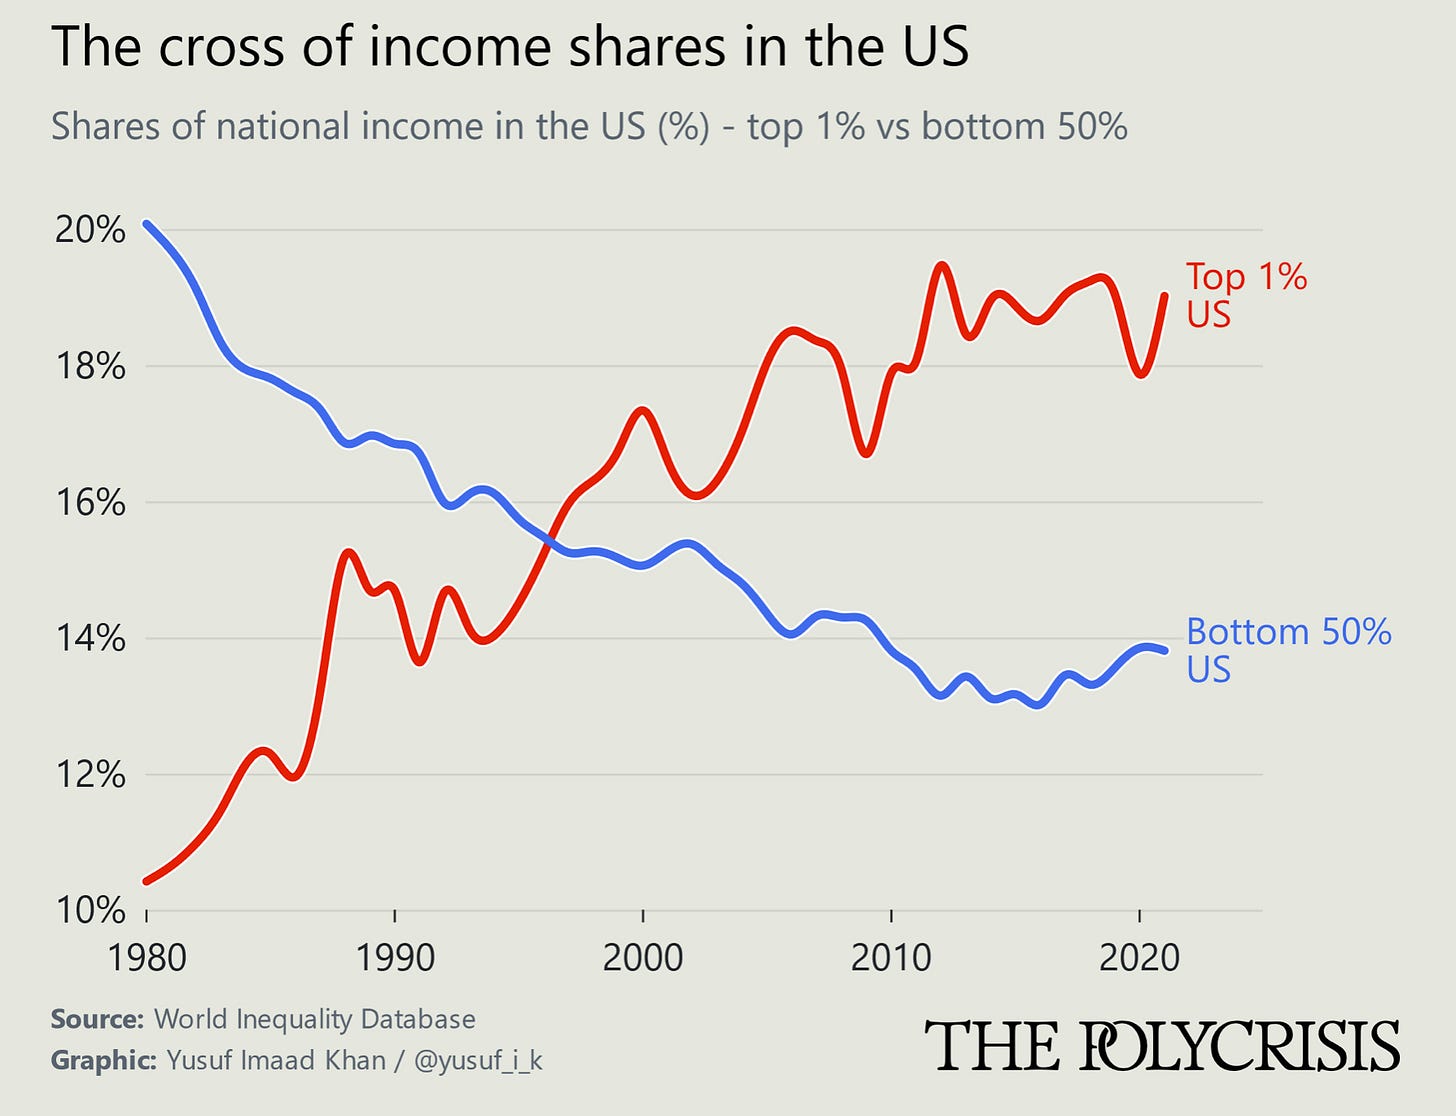
Or that it was really a fight about income, although the timeline along the bottom is very different.
Roberts and Lamp describe this as a ‘left-wing narrative’, which it is:
According to the “left-wing populist narrative,” this cross captures the various ways in which national economies have been rigged to channel the gains from globalization to the privileged few, exacerbating inequality. From stagnating minimum wages to a predatory financial system, this narrative sees the economy as systematically skewed against the interests of the working and middle classes.
Tax
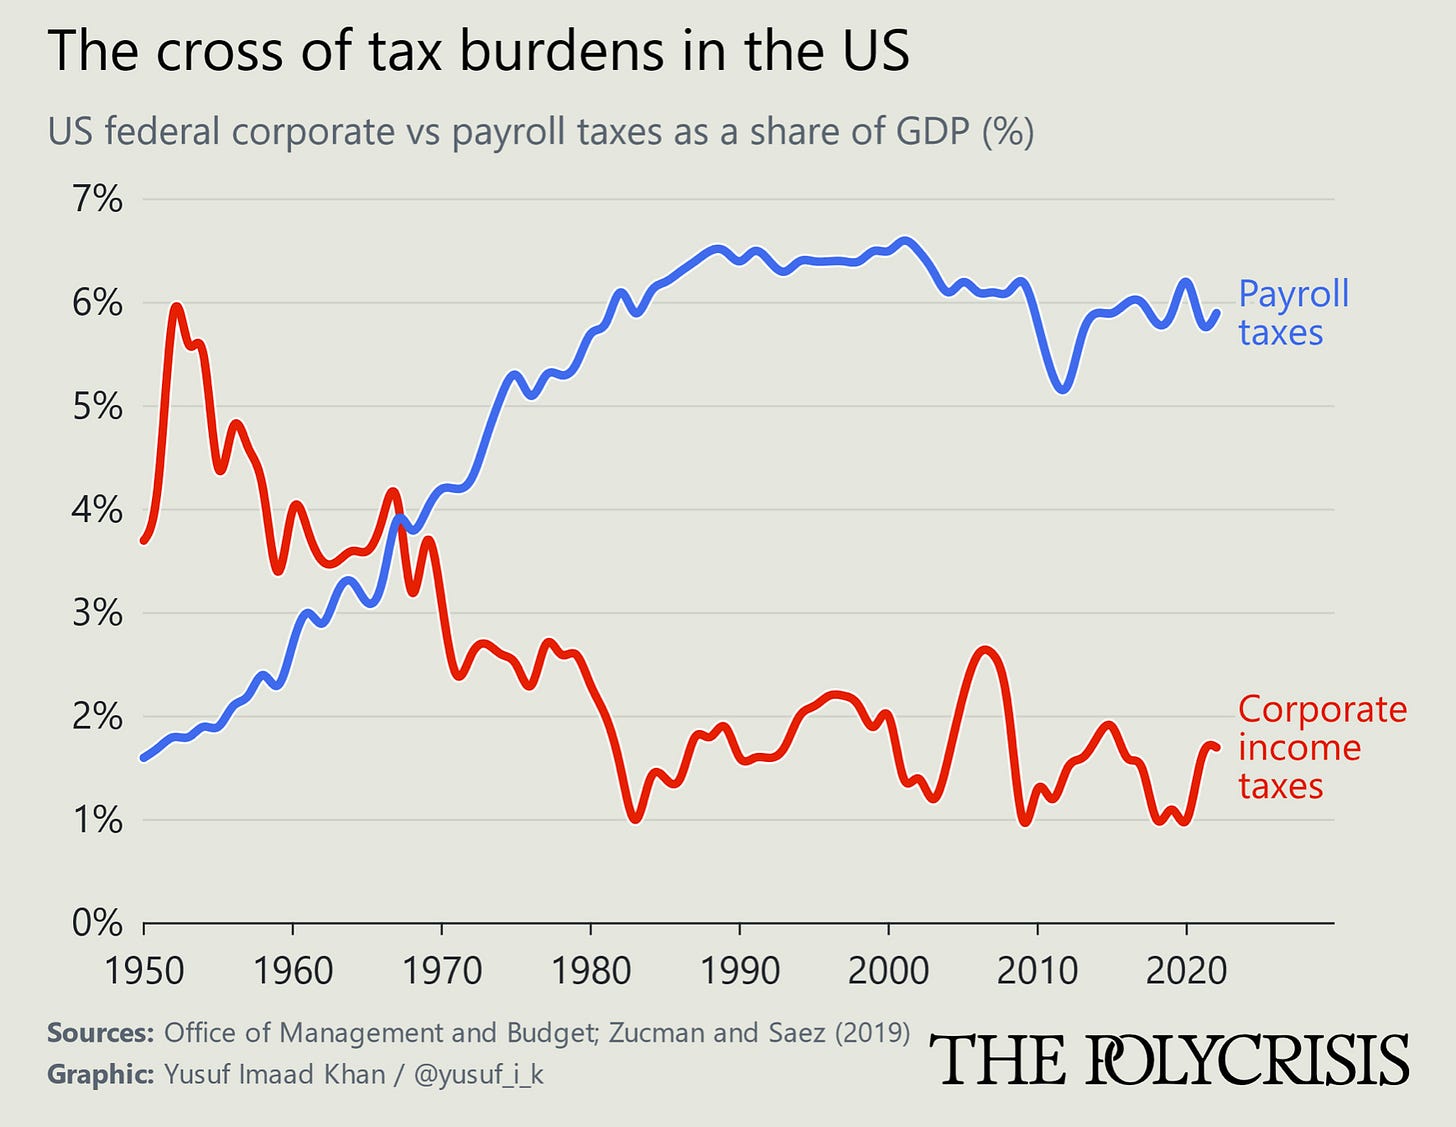
And this narrative links to the ‘tax’ cross, again with American data:
corporations have also exploited the pressures of globalization to get governments to shift the burden of taxes from mobile factors of production, such as capital, to relatively immobile factors, in particular labor. While corporate profits have soared, corporate tax rates have collapsed.
Roberts and Lamp are a bit even-handed about all of this:
Our debates about economic globalization tend to be siloed or polarized... If we want to understand the complexity of the issues facing us—such that we can move toward useful interventions—we need to find ways of simultaneously keeping all these hockey sticks and crosses in our minds.
Sure, and it does help, I think, to think of these as competing narratives that represent different assumptions about how the world works. But the crosses, in particular, make power a lot more visible.
As George Box once said: all models are wrong, but some are useful.
2: The British have almost stopped getting married
The journalist Lewis Goodall has spent some time looking into British statistics on marriage, looking back over fifty years, and he did a longish thread on twitter on how sharply it has changed over that time. In what follows, he’s not taking a view either way on the merits or not of marriage as a social institution (although the reason he got interested in the data, you discover at the end of the thread, is that he got married a few days ago).
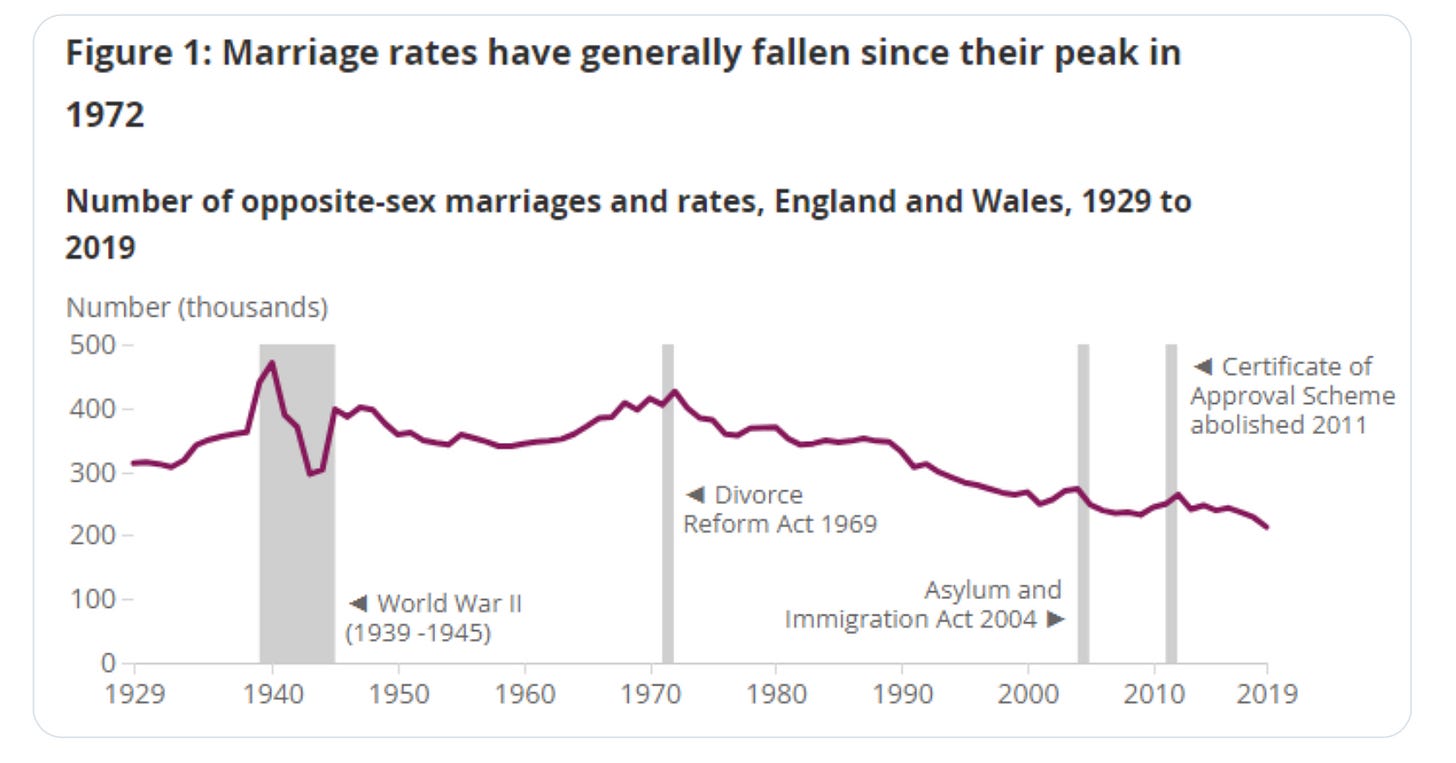
He uses the 2019 data as the most reliable recent year, and compares it with the early ‘70s, and what’s interesting is that the number of marriages has pretty much halved in that time. (Population has grown in that time, although there are now fewer young people).
And, in fact, 1972 was the year of peak marriage in the UK:
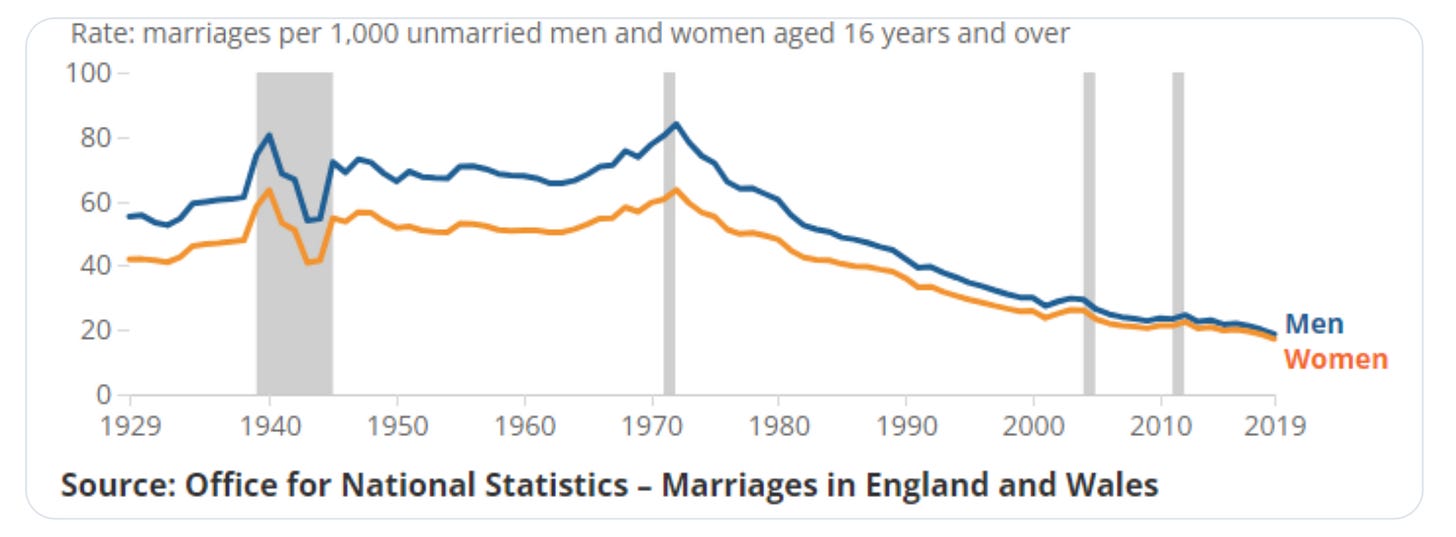
That’s total numbers. But the data on the proportion on unmarried men and women who got married in those two years is even starker.
In 1972 there were 84 marriages per 1000 unmarried men and 63.5 for women. In 2019 it was 18.6 marriages per 1000 unmarried men and 17.2 for women.
To put it another way in 1972 1 in 12 of all unmarried men in the country got married! You were very likely to know people getting married each and every year. In 2019 that fell to fewer than 1 in 50.
The data for the age at which people get married is also striking. In 1976, 28% of women were married by the age of 20; 77% by the age of 25; 91% by the age of 30.
Today, about one in three women are married by 30, and one in four of men.
The age of first marriage has also gone up sharply:
50 years ago the average age - for a first-time marriage - was 22.8 for women and 25.1 for men. In 2019 for a it was 31.5 and and 33.4.
One of the conclusions that Goodall reaches in the face of this data is that the cultural idea that the 60s were a ‘permissive society’ is wrong. In terms of most people’s lives, the 1960s and 1970s were more like the 1950s or even the 1930s.
(Although: the idea of the permissive society is better understood as a cultural framing of the early signs of social change around attitudes to both sex and to gender relations, rather than an indication of the average.)
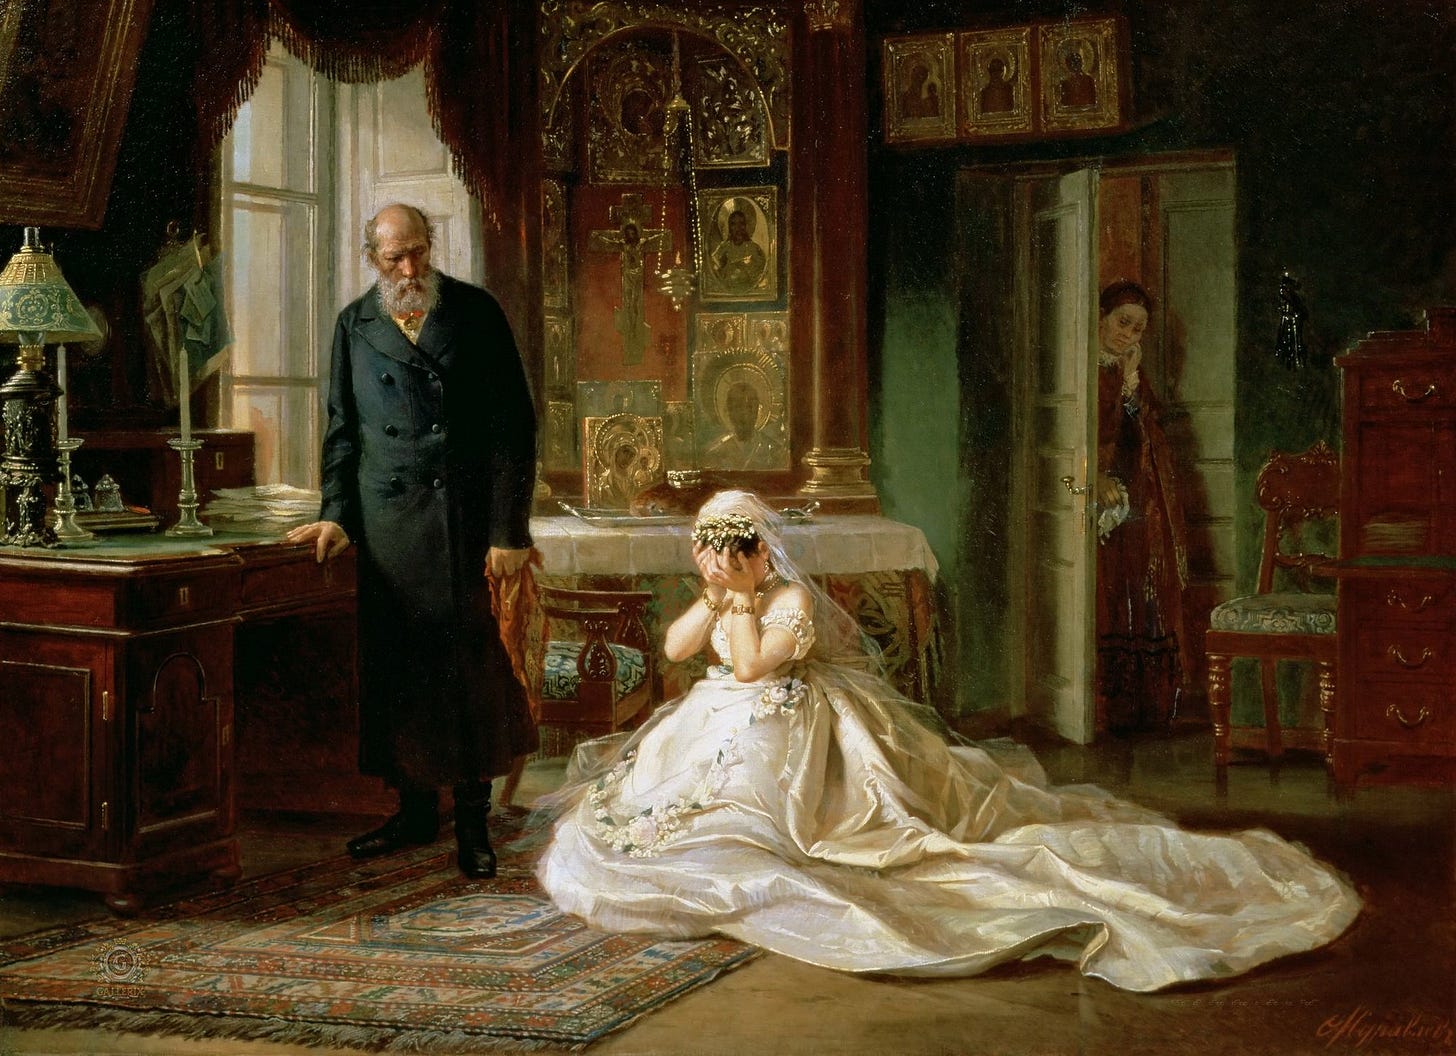
(Firs Zhuravlev, ‘Before the Wedding’ [1874]. Via Gandalf’s Gallery/flickr, CC BY-NC-SA 2.0)
So what’s going on here? Several things, he suggests.
The first is cultural:
Co-habitation is so much more common today than it was then and that can only be a good thing. Same sex couples can also get married today and they couldn't then, which is an unalloyed good. So many more women have careers, choices and better lives than then.
And all of this represents a secular shift in social values and behaviours which is unlikely to be reversed.
Other factors, which he wraps up a bit, are social and economic. One reason is that young people are now much more likely to be in education and training for longer than they were in the 1970s, when around 10% of the UK population went to university.
Another is cost. People who have been to university are more likely to have debt, everyone faces heavy housing costs (and flatlining real wages, which he doesn’t mention) and this makes it harder to afford to settle down and start a family.
Goodall describes this as a form of “extended adolescence”, but that phrase seems to me to muddle psychological and emotional factors with socio-economic ones. Either way:
So in half a century we've seen a profound change in the way early adulthood is conducted, for both sexes, when "settled" life begins, when families are likely started. These changes are probably going to be intensified by the pandemic and the economic crisis we're in.
He doesn’t make any historical comparisons here, but in general (recalling some research I did a while ago, repeated here unchecked) the age of marriage has gone up and down over time depending on the ability of couples to afford to live independently.
Is this a bad thing? Well, it seems to be contributing to falling numbers of births, although that could be influenced by other factors. Deloitte’s research on GenZs and Millennials, which I mentioned earlier this week, said they were less likely to have children because of climate change.
And we should worry about fewer births because it accelerates the problem of an ageing society, with a smaller working population relative to an older non-working population, which we still haven’t worked out how to manage, socially or economically.
One way to deal with this is to enable migration, which tends to be done by younger people with families, and our sometime membership of the EU was a convenient way to do this. If we really want to discourage immigration, which I believe is British government policy at the moment, we need to look to economic issues.
My guess is that we’d see an uptick in marriages, and a bigger uptick in birth rates, if some of the economic barriers to forming and raising families were eased. Goodall mentions some of these:
a government gets really serious about some of the reasons why adolescence now has to last into the 30s and beyond: crippling housing costs, crippling childcare costs, student loan repayments etc.
And that would require a systemic approach to policy, and shifting some public funding from the old to the young.
j2t#488
If you are enjoying Just Two Things, please do send it on to a friend or colleague.
